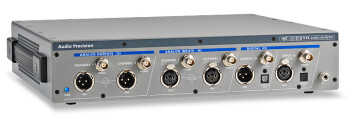
At AudioFanzine we invested in equipment that allows us to measure audio performance of products we review. However, it is not always easy to understand the flood of numerical values that can reveal the performance of a piece of gear. That's why we'll try to make things clearer here...
Sound engineers generally agree that just a few measurements are enough to get an idea about the performance of an audio equipment. Here are the six measurements that are most commonly used: level, distortion (THD+N = Total Harmonic Distortion + Noise), frequency response, Signal-to-Noise Ratio (SNR), crosstalk, and phase.
Level and gain (in dB, the best value is the highest value)
Here we just measure the maximum output level (also called maximum amplitude) of a product before clipping. One of the measurement units is dBV. The gain, used for amps and preamps, gives the ratio between input and output levels of the unit. With a given input level, the higher the output level, the higher the gain. For preamps, the gain is an important spec because some low-level signal sources and some microphones require a high preamplification gain to ensure quality recordings.
Generally speaking, sound engineers use the decibel (dB) to measure the level because this logarithmic unit allows them to state large differences with small figures. Actually the decibel is a ratio between two values, so when you make measurements you have to decide what is going to be your reference. The dBV refers to the Volt, so 0dBV = 1 Volt. Each time you add 6 dB, the voltage is doubled. You’ll also find dBu, where 0dBu = 0.7746 Volt. On pro-audio gear, the 0 mark in VU-meters means +4dBu, while consumer products use a lower nominal level of –10dBV. However, many products allow the user to choose between these two levels.
Harmonic distortion (in dB, the best value is the lowest)
It measures everything that doesn’t inherently belongs to the audio signal, in other words everything you don’t want to hear. For example, units that attempt to generate a pure sine systematically add distortion in the form of harmonics, which where not there in the first place. If the signal is a 1kHz sine wave, the harmonic frequencies are often multiples (2, 3 or 4Hz and so on). The THD measurement sums all the harmonics, and the goal of manufacturers is to have as little distortion as possible. But you’ll often see the THD+N measurement unit, which also takes the background noise of the unit into account, that is to say the energy generated by the unit regardless of the input signal. This noise generally comes from the PSU, interferences or other components. So choose gear with the lowest possible THD+N.
The THD+N level is often expressed in Volts RMS or in dB, but we prefer the ratio (in dB or %) between the noise+distortion level and the total level. The THD+N value of an amplifier is generally 0.01% or –80dB (in dB, the values are always negative because the distortion+noise level is always smaller than the total level).
Frequency response (deviation in dB, the best value is the lowest)
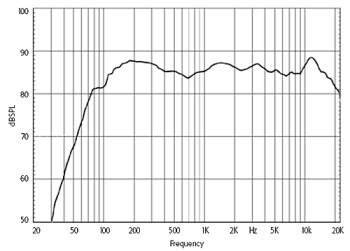
Some readers might already know this measurement, which indicates the output level depending on the frequency. You usually get a nice graph with the audio frequencies (in Hertz) on the horizontal axis and the level (commonly in dB) on the vertical axis. The goal is to have the most linear frequency response so that the unit reproduces all frequencies consistently. The measurement tool sends the test unit a signal that sweeps across all frequencies and then draws its response curve.
Once the measurement is complete, you can determine the deviation between 20 Hz and 20 kHz, which allows you to describe the “linearity” of the frequency response with a figure. If the level values vary from 0 to –3dB, the deviation is ±1.5dB. The smaller this number, the “flatter” the frequency response and hence better the tested unit.
Signal-to-noise ratio (in dB, the best value is the highest value)
The signal-to-noise ratio (or SNR) measures the amount of noise in the signal. It usually depends on the noise of the output signal: when you crank an amp or a preamp, is there any noise?! To make our measurement, we first monitor the noise level when no signal is present in the input of the tested unit, then the level with a signal in the input, and we divide the latter by the former. Like the THD+N, the SNR is expressed in dB. But while the THD+N gives very low figures (0.01% or –80dB) because it divides the noise+distortion level by the signal, the SNR gives high figures (e.g. 100dB) because it divides the signal by the noise. For audio equipment, the measurements are made in the audible frequency range (20Hz–20kHz) since everything above or below plays no significant role. It also happens that the result is weighted with filters so that the result matches the response curve of the human ear. In fact, our ears are more sensitive to some frequencies, and noise at 30 Hz will be less obvious than at 2 kHz. For audio gear, always try to get the highest possible SNR.
Crosstalk (in dB, the best value is the lowest)
Crosstalk is an important measurement as soon as you test a unit with several audio channels. The goal is to monitor the leakage from one channel to another. To do this, we send a signal into a channel (for instance the left channel in a stereo unit) and we measure the output level of the neighbor channel (the right channel), which is fed no signal. In a perfect world, nothing would come out of the right channel and crosstalk would be zero. But in real life, a certain signal amount does come out of the right channel, which is supposed to be muted. The measurement consists in dividing the level of this signal by the signal level in the input channel. This ratio is often expressed in dB.
Phase (in dB, the best value is the lowest)
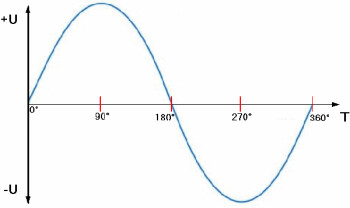
In audio technology, the phase refers to the time relation between two signals at the same frequency. Every sine wave has an amplitude and a frequency (number of cycles per second), generally represented in a graph with time on the horizontal axis and amplitude on the vertical axis. The period of a sine wave is the duration of one cycle. At the end of the period, and hence the cycle, the wave comes back to the initial point. You can divide the cycle into degrees, from 0 to 360: for example, if you were to spin and do a full turn (360 degrees) you’d come back to the initial point.
As shown on the graph opposite, the wave reaches its maximum positive amplitude at 90° degrees, comes back to zero at half the period (180 degrees), reaches the maximum negative amplitude at three quarters of the period (270 degrees), and finally comes back to zero at the end of its cycle (360 degrees).
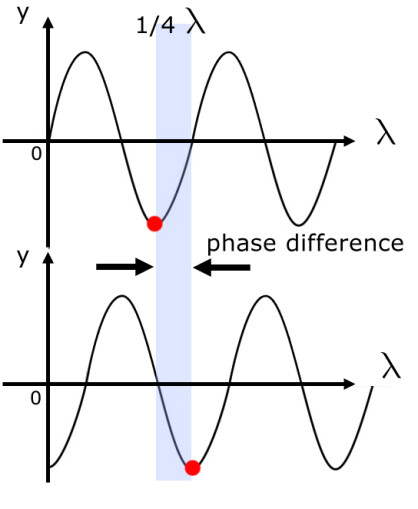
Two sine waves are said to be “in phase” when their cycles start at the same time. They are “out of phase” when their cycles are not synced, as shown in the graph:
A phase offset or difference is often inaudible on one single channel. But when at least two channels are involved and they are out of phase, it can cause level variations (additions or subtractions) at given frequencies. With a simple sine wave (only one frequency), you’ll be able to hear level spikes and dips. With a complex wave (combination of several frequencies), some frequencies will be affected (amplified, attenuated or even canceled) while others will be unaffected, which will impact the frequency response of the combined signals. Phase offset in audio material is sometimes due to the presence of delays in the audio path, which might be caused by analog components or by Digital Signal Processors (DSP). If some channels are delayed while others aren’t, there will be a phase offset between them. With pro audio gear, the best is to have the lowest possible phase offset.
Now you know all six essential audio measurements. And from now on their results ought to be no mystery to anyone.


